Join over 10,000 subscribers that receive running routines, motivation, tools, playlists & giveaways. Sent to your inbox every day.
RunnerClick Team
Megan Robinson
Sports Dietician
Evan Wood
RRCA Level 1 Running Coach
Whitney Heins
VDOT-02 Running Coach
Ana
Chief Editor
Brian Price
Editor
Pam Berg
Running Coach
Amber Nelson
Obstacle Course Racer
Tara Summerville
Road Runner
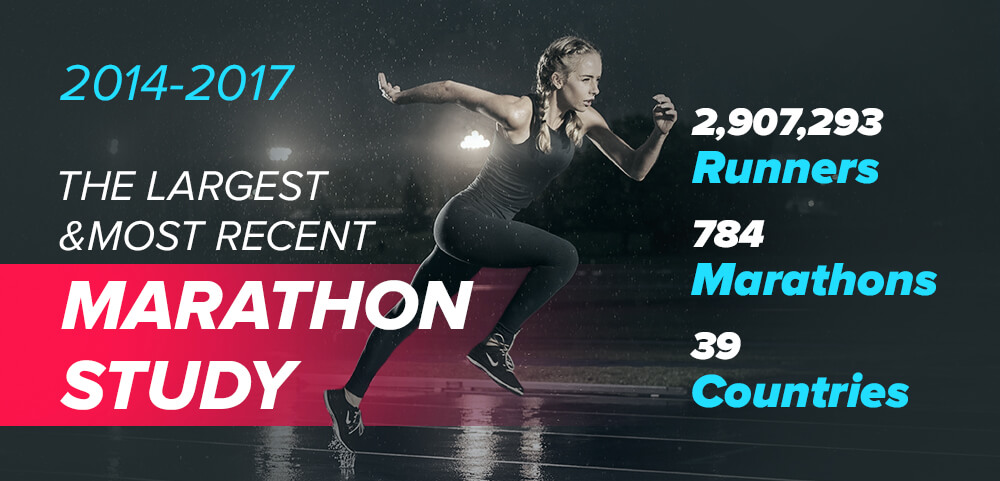
World’s Largest & Most Recent Marathon Study
RunnerClick
In the largest marathon study of recreational runners ever conducted, we researched marathon data information from all over the world and compiled a total of3.5 millionmarathon data records, which is the most that have ever been collected. The information researched included 196marathons from the years 2014-2017, and 238nationalities that span out over 39countries and7 continents in total. Below you will find the most interesting and compelling statistics discovered throughout this study.
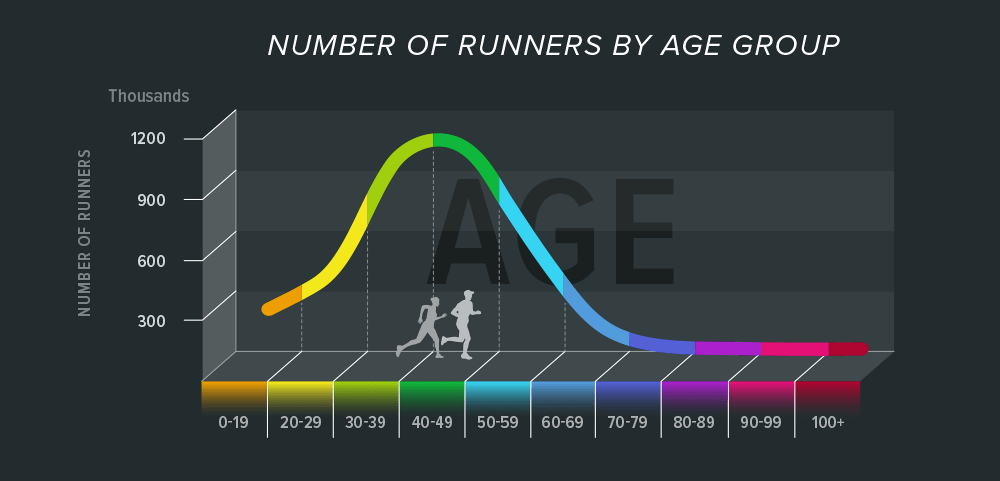
Age Distribution
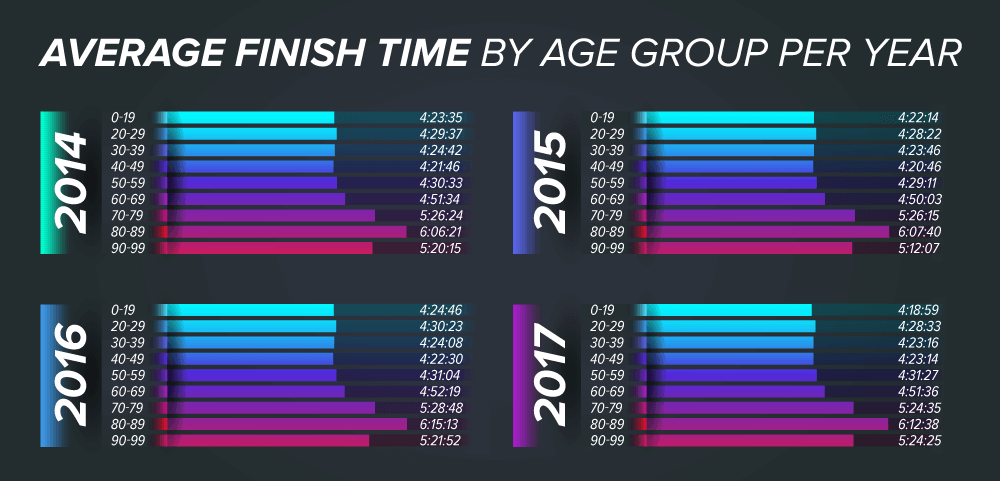
The fastest age group is 40-49 with an average time of 4:22:03
The fastest age group for men is 40-49 with an average finish time of 4:11:19
The fastest age group for women is 20-29 with an average finishing time of 4:42:10
In this study, we also looked at the marathon statistics pertaining to the different age groups and how those age groups were performing in running over the years of 2014-2017. Age group 40-49 is the fastest category with an averaging finish time of 4:22:03, the age group 0-19 is neck and neck, only lagging by a mere 14 seconds and in third is the age group 30-39 with an average finish time of 4:23:59. Age Group 80-89 closes the table with an average finishing time of 6:09:48. When it comes to age groups pertaining to each gender, the fastest age group for men is 40-49with an average finish time of 4:11:19 and the fastest age group for women is 20-29 with an average finish time of 4:42:10. When we looked at each individual year, the age group 40-49 took the gold for every year, with the exception of 2017 where the age group 0-19 took the win.
RunnerClick
RunnerClick
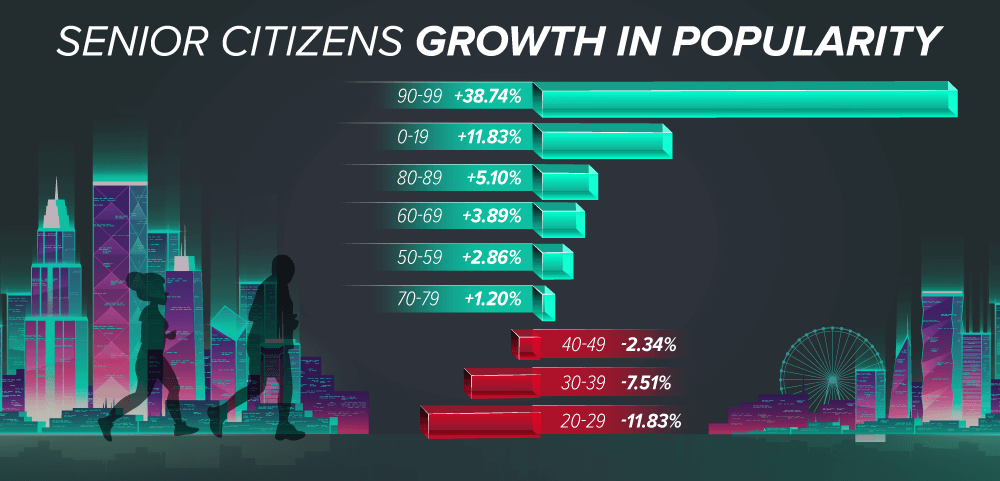
Senior Citizens Take the Lead
Age group 90-99 had the highest growth in participation at 41.36% in 2015
Age group 90-99 also had the highest overall growth in participation from 2014-2017 with an increase of 38.74%
Age group 20-29 had the highest decline
Age group 40-49 is most popular in all continents except North America
Age group 40-49 and 30-39 make up more than 60% of marathon runners
We also looked into the overall participation for each age group and the results might shock you! The highest growth was in the age group of 90-99 for the year 2015 at 41.36%. This same age group had the biggest growth in overall participation rate through 2014-2017 with an increase of 38.74%. The age group with the highest decline was 20-29, there was no country within this study in which this age group was the most popular, and the only nation in which the age group 50-59 was most popular is South Korea. The age group 40-49 ranks the most popular age group in 29 countries, the age group 30-39 is the most popular in 20 countries, and the youngest age group 0-19 is the most popular in 5 countries. The age group 40-49 is the most popular in all continents with the exception of North America, where the age group 30-39 is the most popular. The two biggest age groups of marathon runners is 40-49 which is 30.84% and 30-39 which is 31.08%. These two age groups make up for more than 60% of marathon participation.
RunnerClick
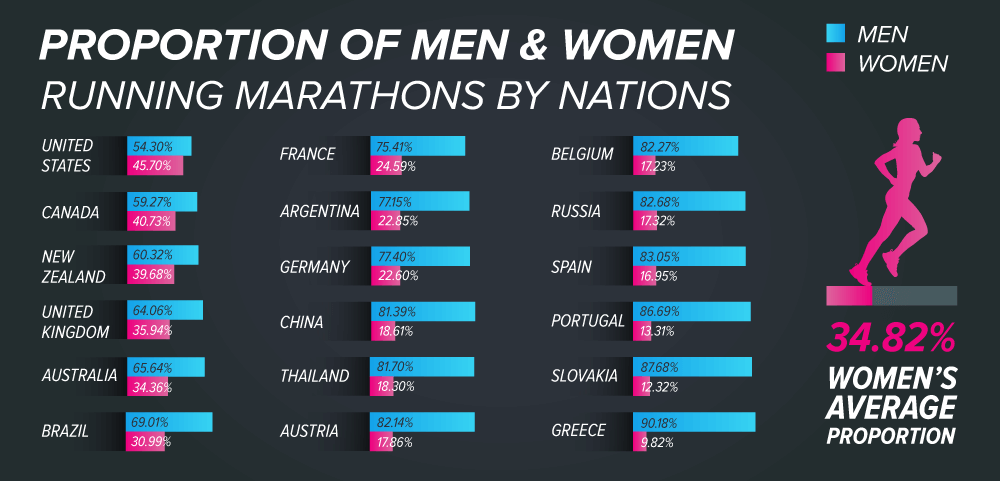
Who Runs the World?
World average of women runners is 34.82%
The United States had the highest proportion of women runners at 45.7%
Ukraine had the highest growth of women runners at 383%
Our marathon statistics show ⅓ of marathon runners are women with the world average being 34.82%. The countries with the highest proportion of women runners are the United States at 45.7% and Canada at 40.7%, which makes the United States the most gender equal nation in the marathon world. The smallest proportion of women runners is in Greece at 9.8%.
RunnerClick
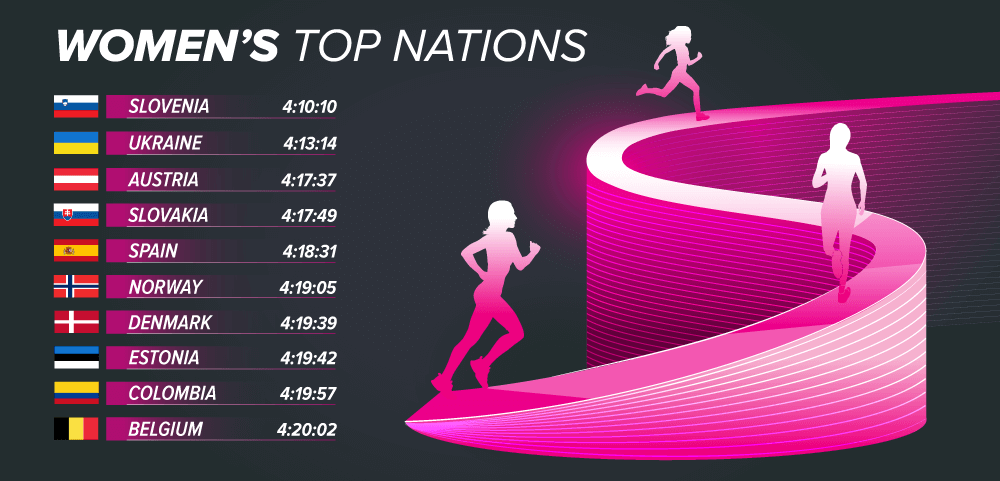
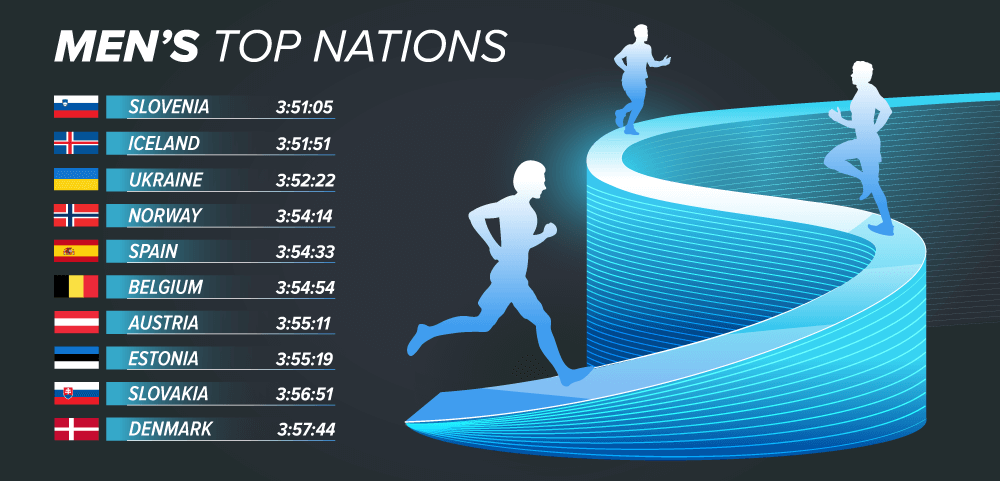
A Foot Above the Rest
Slovenia is home for the fastest average finishing time for men and women
The fastest average for women in 2017 was from Slovenia with an average finish time of 4:11:22
The fastest average for men in 2017 was from Ukraine with an average finish time of 3:51:10
Our study also revealed the top 10 nations with the leading average finish time for women and the top 10 nations with the leading average time for men. The fastest averages for women in 2014 was from Ukraine with a time of 4:08:48. In 2015, the fastest average for women was in Slovenia with a finishing time of 4:06:53 and in 2016 the fastest average for women was from Spain with a time of 4:08:42. The fastest average finish time for women in 2017 was from Slovenia with a time of 4:11:22. The fastest average for men in 2014 was from Iceland with the average finishing time of 3:43:19. In 2015 and 2016 the fastest average for men was from Slovenia with average finishing times of 3:49:45 and 3:52:20. Ukraine had the fastest men overall, boasting an average finish time of 3:51:10 in 2017.
RunnerClick
RunnerClick
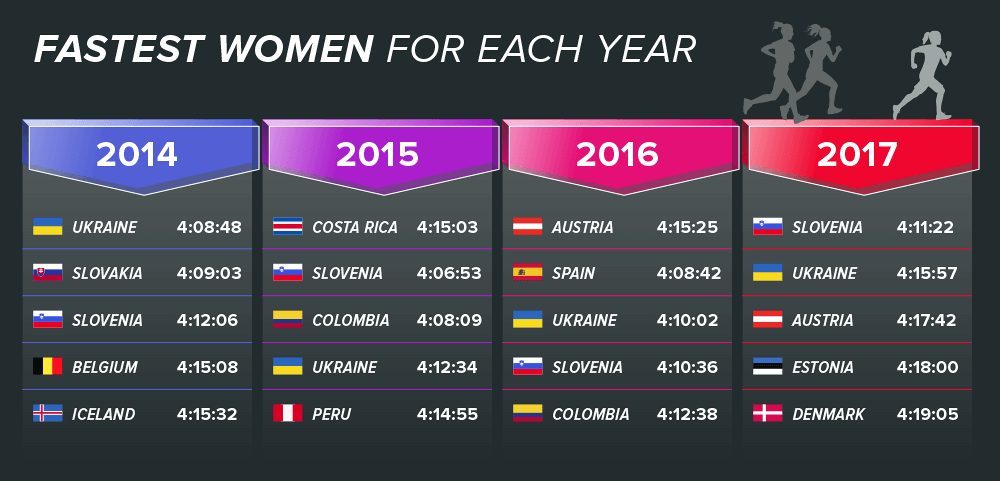
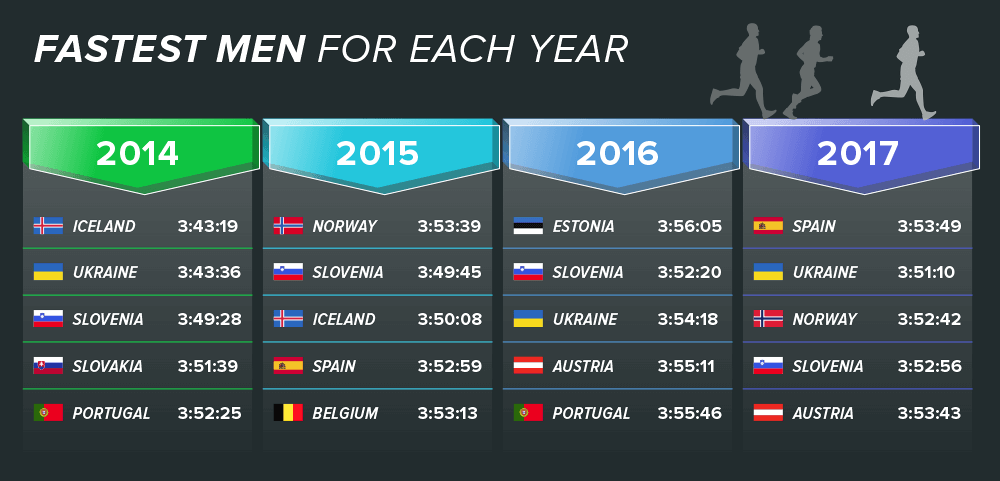
Fastest Nations For Each Gender Over the Years
Iceland, Slovenia, and Ukraine landed in the top 3 fastest nations for the men all 4 years
Ukraine and Slovenia held strong for the women over the 4 years
When it comes to the fastest nations for each gender, we decided to look into the top fastest nations for each gender for each of the years. The top 3 fastest nations for the women in 2014 were Ukraine (4:08:48), Slovakia (4:09:03), and Slovenia (4:12:06). In 2015, Costa Rica (4:15:03), Slovenia (4:06:53), and Colombia (4:08:09) took the lead. In 2016, Austria (4:15:25), Spain (4:08:42), and Ukraine (4:10:02) took the lead and in 2017, Slovenia (4:11:22), Ukraine (4:15:57), and Austria (4:17:42) topped the leaderboard.
As for the men, the top 3 fastest nations in 2014 were Iceland (3:43:19), Ukraine (3:43:36), and Slovenia (3:49:28). In 2015, Norway (3:53:39), Slovenia (3:49:45), and Iceland (3:50:08) took the lead. In 2016, Estonia (3:56:05), Slovenia (3:52:20), and Ukraine (3:54:18) took the lead. In 2017, Spain (3:53:49), Ukraine (3:51:10), and Norway (3:52:42) took over the leaderboard.
RunnerClick
RunnerClick
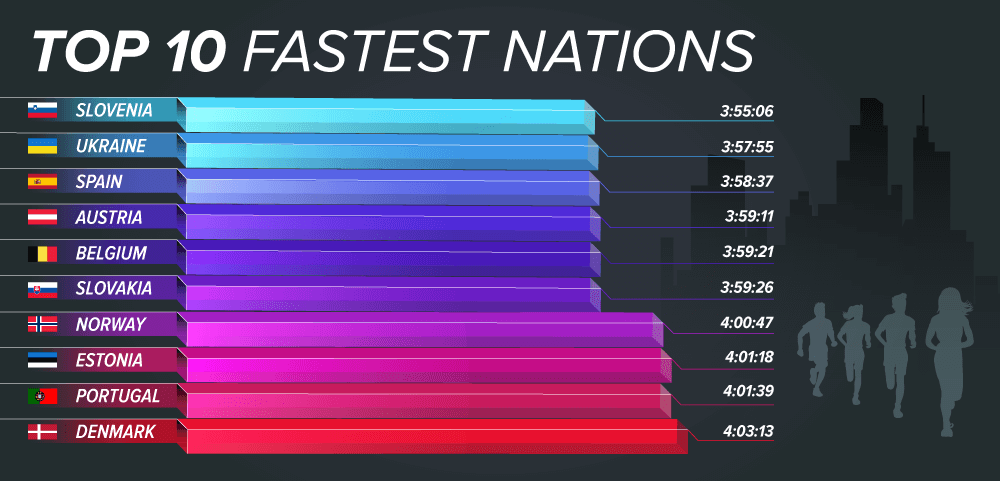
Runners From Slovenia and Ukraine are the Fastest in the World
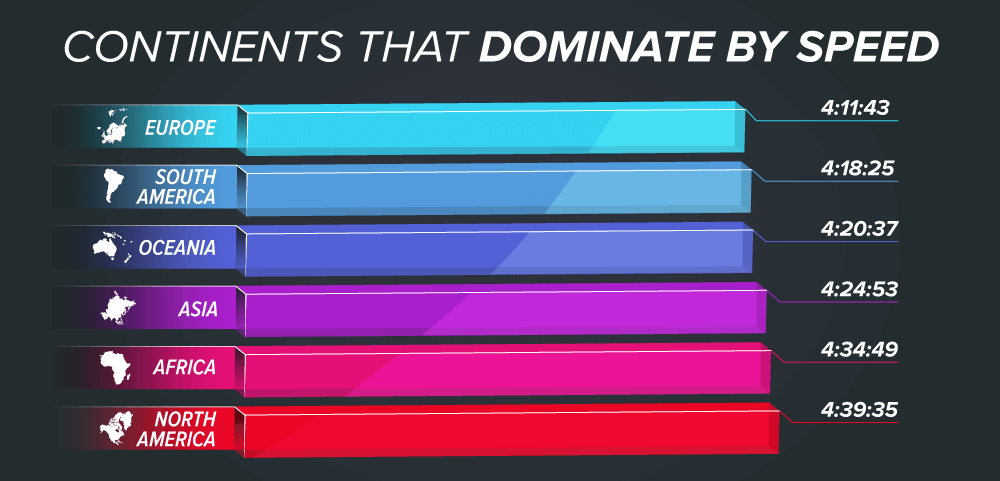
Europe dominates with an average finish time of 4:11:43
Slovenia ranks as the fastest nation with a time of 3:55:06
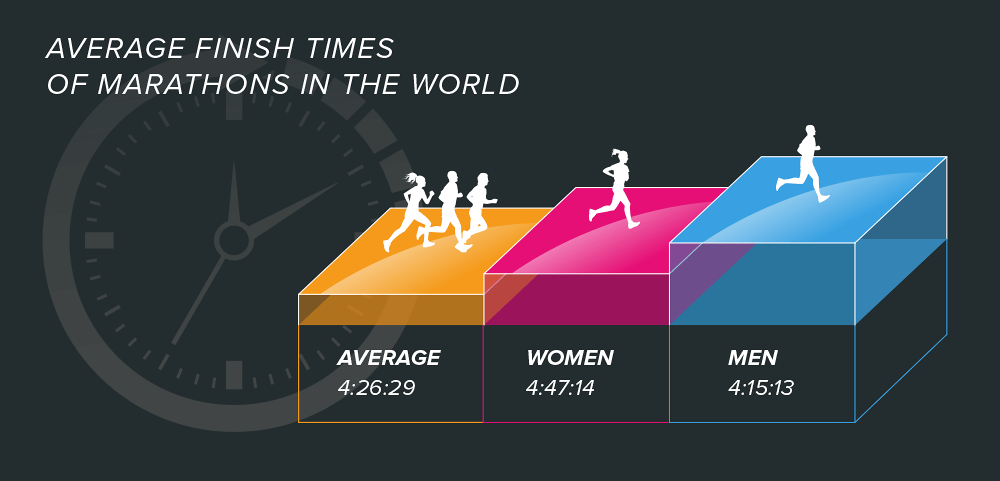
World’s average finishing time from 2014-2017 is 4:26:29
According to our recent marathon statistics, Europe is dominating when it comes to speed with an average finishing time of 4:11:43. They have surpassed every continent by 7 minutes or more, making this continent stand out from the rest. Although Spain was the fastest nation in a previous study with an average finishing time of 3:55:35, there are two countries that have taken the lead in this recent study, Slovenia with an average finishing time of 3:55:06 and Ukraine with an average finishing time of 3:57:05, which now puts Spain in 3rd place when it comes to speed, with an average finishing time of 3:58:37. The world’s average finishing time from 2014-2017 is 4:26:29, with the men’s average finishing time being 4:15:13 and the women’s average finishing time being 4:47:14.
RunnerClick
RunnerClick
RunnerClick
RunnerClick
Thailand, Puerto Rico, and Mexico Home to the Slowest Runners in the World
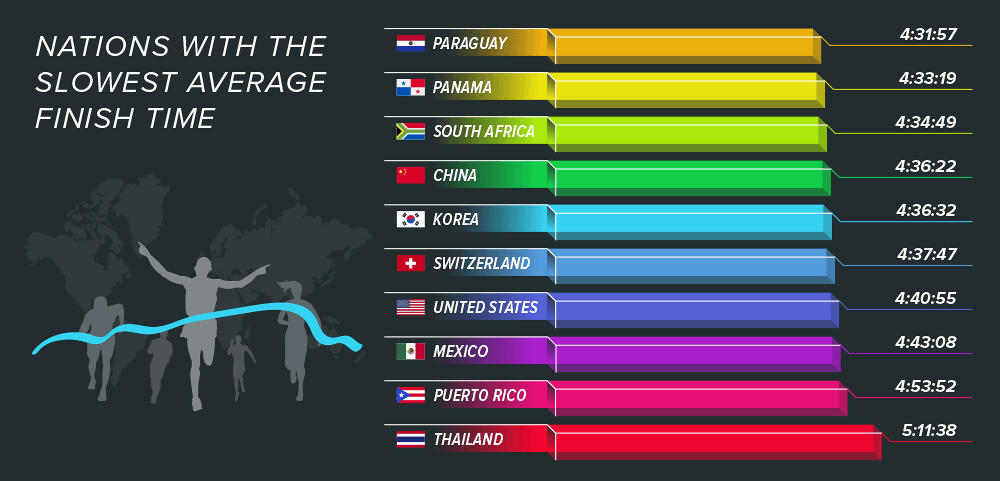
Paraguay tops the slowest average finish time list with 4:31:57
Thailand is the slowest nation with an average finish time of 5:11:38
The slowest average men (5:09:32) and average women (5:21:00) are also from Thailand
Our study also revealed the top 10 nations with the slowest average finishing times for the years 2014-2017. The first nation on the top of the slowest finishing time list is Paraguay with an average finishing time of 4:31:57, followed by Panama with a time of 4:33:19, South Africa with a time of 4:34:49, China with a time of 4:36:22, Korea with a time of 4:36:32, Switzerland with a time of 4:37:47, the United States with a time of 4:40:55, Mexico with a time of 4:43:08, Puerto Rico with a time of 4:53:52 and the slowest nation is Thailand, with an average finishing time of 5:11:38. Surprisingly, the slowest average men 5:09:32 and the slowest average women 5:21:00 are also from Thailand.
RunnerClick
Nations with the Highest Decline
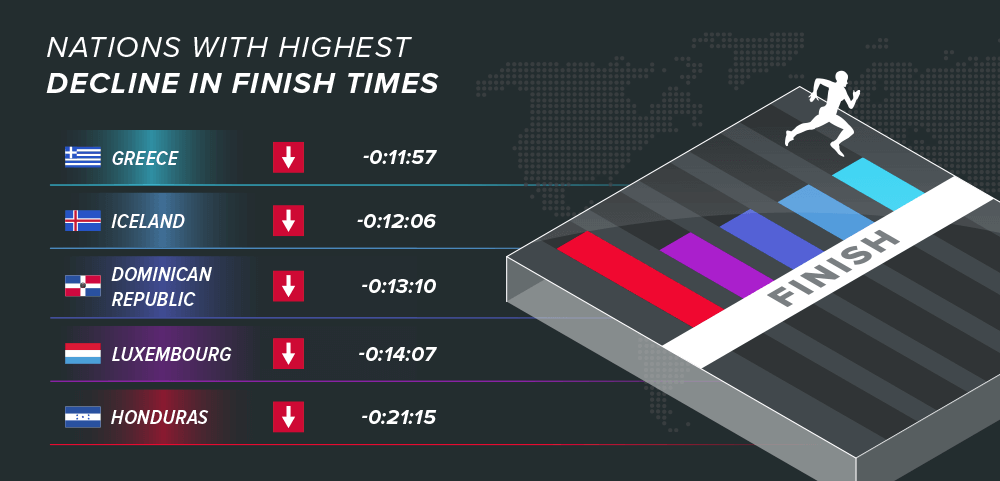
Honduras had the highest decline by a time of -0:21:15
Luxembourg had the second highest decline by a time of -0:14:07
We also discovered the nations that have had the highest decline in finishing times. One would think that the countries that are on the slowest average finishing time list would also be on this list, but that’s actually not the case. The nations with the highest decline were Honduras by a time of -0:21:15, Luxembourg by -0:14:07, the Dominican Republic by a time of -0:13:10, Iceland by -0:12:06, and Greece by -0:11:57.
RunnerClick
Nations that Showed the Most Improvement
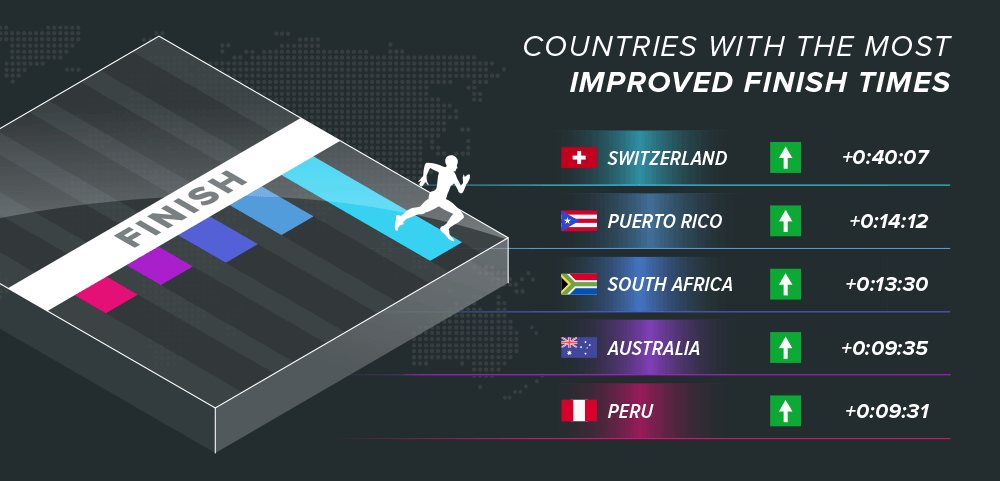
Switzerland had the most improvement by a time of +0:40:07
Puerto Rico came in second with an improved time of +0:14:12
Along with the slowest nations and the nations with the highest decline in finishing times, we discovered the nations that have improved the most from 2014-2017. Even though Switzerlandwas on the list as one of the slowest nations for an average finishing time, they have also shown the most improvement by a time of +0:40:07. Puerto Rico was the second nation with the most improvement by +0:14:12, South Africa was third in the ranking by +0:13:30, Australia was fourth by +0:09:35, and Peru was fifth by +0:09:31.
RunnerClick
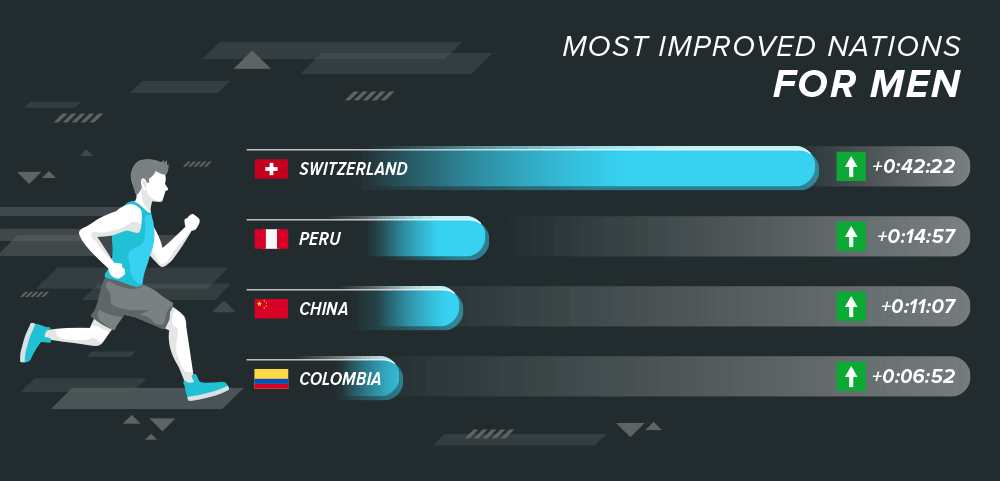
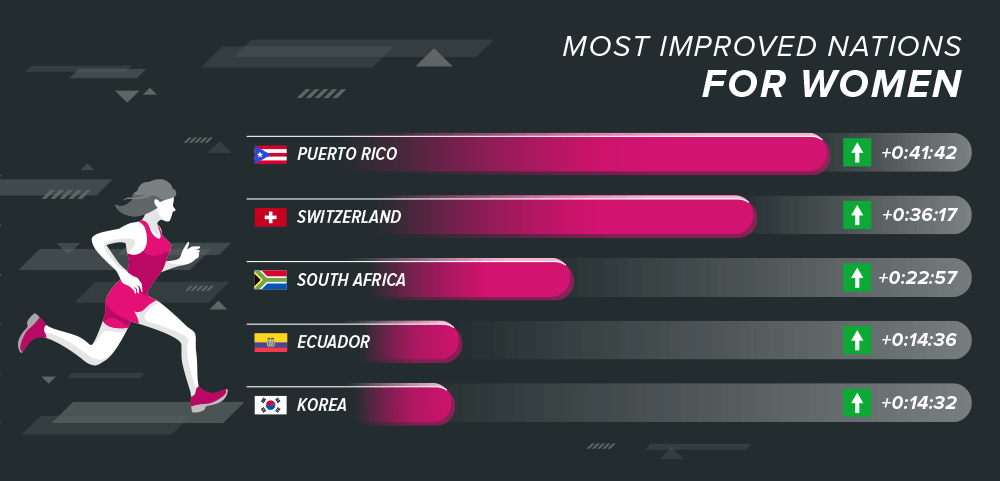
Breakdown of Most Improved Nations for Each Gender
Most improved for men is Switzerland by a time of +0:42:22
Most improved for women is Puerto Rico by a time of +0:41:42
We also took a look into the marathon statistics from these nations and came up with the most improved times for both men and women. For the men, Switzerland takes the lead with an improved time of +0:42:22, followed by Peru with a time of +0:14:57, China by +0:11:07, and Colombia with an improved time of +0:06:52. For the women, Puerto Rico takes the lead with an improved time of +0:41:42, followed by Switzerland with a time of +0:36:17, South Africa by +0:22:57, Ecuador by +0:14:36, and Korea with an improvement time of +0:14:32.
RunnerClick
RunnerClick
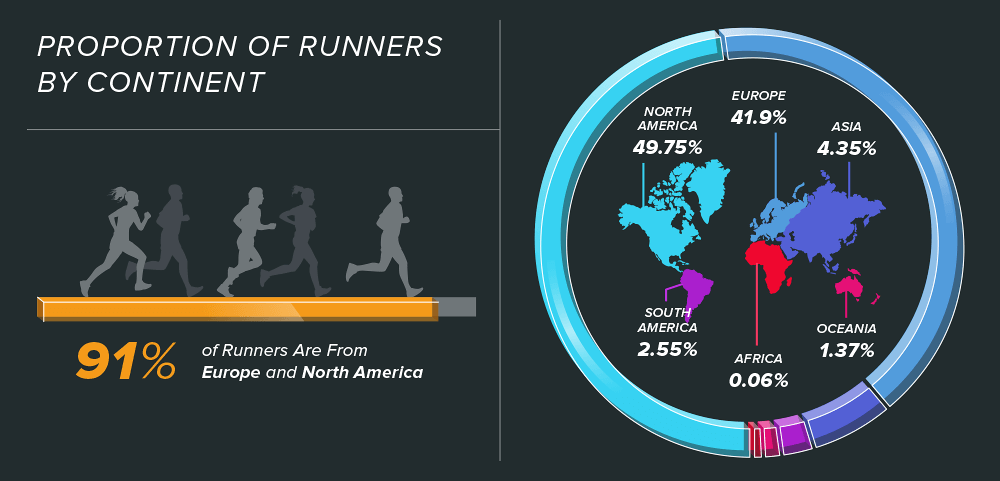
Runner Distribution Over Continents
North America makes up for 49.75% of runners
Europe makes up for 41.90% of runners
According to our marathon statistics study, the numbers show that more than 90% of runners are from North America and Europe. North America has an astonishing 49.75% of runners and Europe comes in a close second with 41.90%. The three continents with the lowest number of runners are South America with 2.55%, Oceania with 1.37%, and Africa with 0.06%. That being said, North America and Europe cover the majority of the area in this study and hold the highest percentage of runner distribution between the years of 2014-2017.
RunnerClick
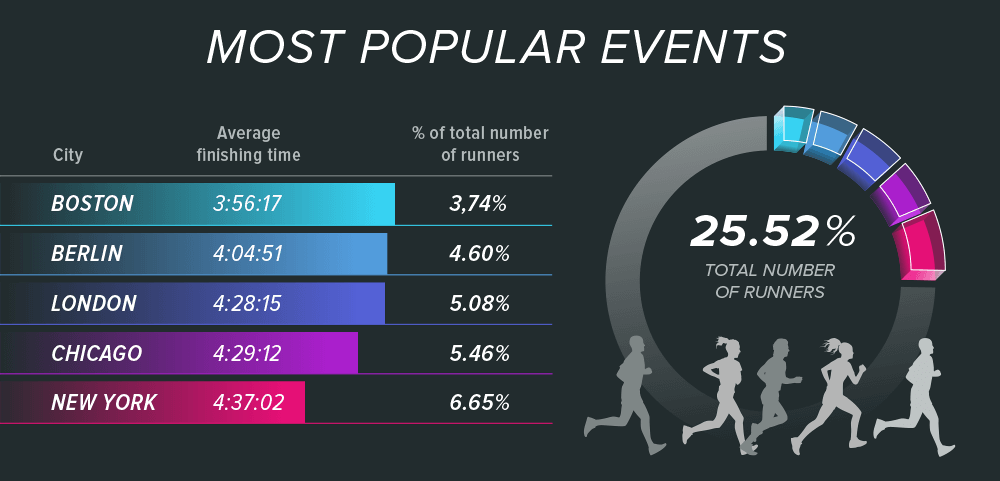
A Breakdown of Events
Boston, Chicago, and New York are the most popular marathons in the USA
Berlin and London are the most popular marathons Europe
The fastest marathon out of this group is Boston with a time of 3:56:17
In our study, we took the liberty of breaking down the marathon data by individual events to determine which ones were the most popular, which ones have had the most improvement or highest decline over the years of 2014-2017, and which one had the best average finishing time. Eindhoven had the best average finishing time of 3:46:53. The most popular events are New York, Boston, and Chicago whichare all in the USA and London and Berlin which are in Europe. More than 25% of all of the runners in the world ran these marathons. The fastest marathon out of the most popular category is Boston with an average finishing time of 3:56:17.
RunnerClick
How Individual Events are Performing
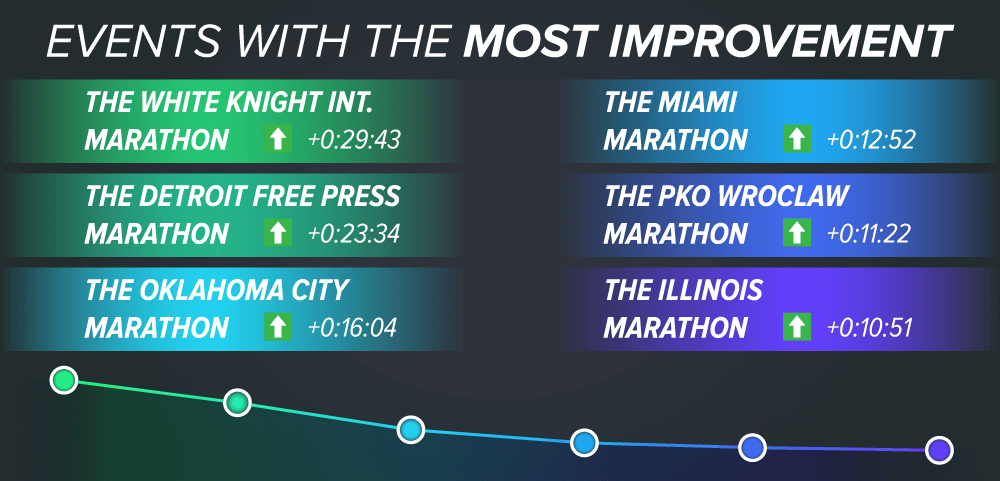
The White Knight Int marathon had the most improvement by +0:29:43
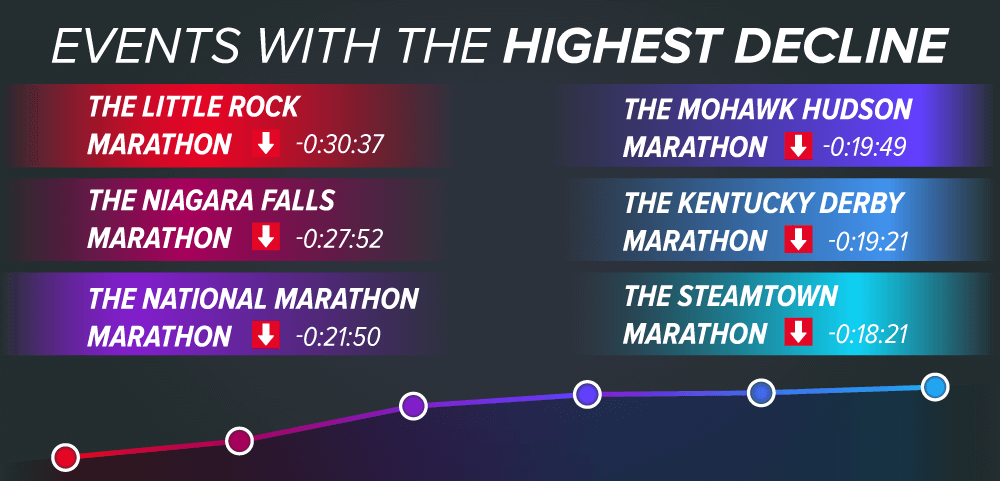
The Little Rock marathon had the highest decline by -0:30:37
When looking into each event, the White Knight Int marathon showed the most improvement of average finishing time by +0:29:43, followed by the Detroit Free Press marathon by +0:23:34, the Oklahoma City marathon by +0:16:04, the Miami marathon by +0:12:52, the PKO Wroclaw marathon by +0:11:22, and the Illinois marathon by a time of +0:10:51. The events with the highest decline in average finishing time were the Little Rock marathon by a time of -0:30:37, followed by the Niagara Falls marathon by -0:27:52, The National Marathon by -0:21:50, the Mohawk-Hudson marathon by -0:19:49, the Kentucky Derby marathon by -0:19:21, and the Steamtown marathon by a time of -0:18:21.
RunnerClick
RunnerClick
RunnerClick
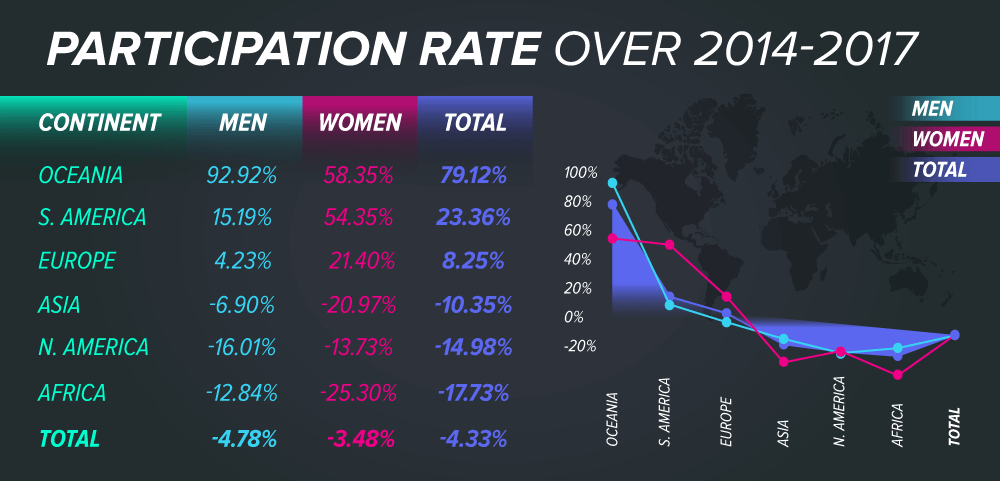
Marathon Participation Over the Years of 2014-2017
The overall participation rate of a marathon showed a decrease of -3.02%
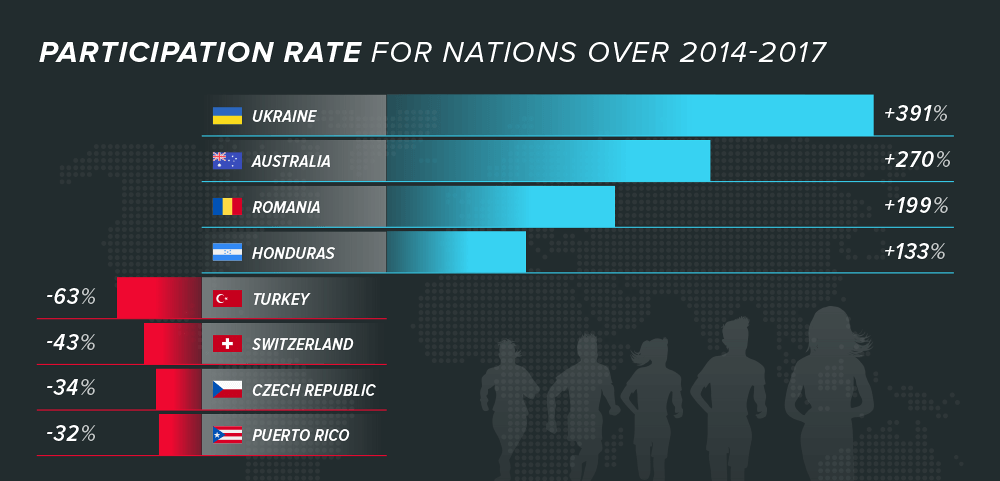
Ukraine had the biggest growth in participation by +391%
Turkey had the biggest decline in participation by -63%
Although the worldwide participation rate did not have a significant change over the years of 2014-2017, there was a slight decrease in the overall participation of a marathon by -3.16%, decreasing by -3.95%for men and -1.65%for women. The top 4 nations with the biggest growth in participation are Ukraine by +391%, Australia by +270%, Romania by +199%, and Honduras by +133%. The top 4 nations with the biggest decline in participation are Turkey by -63%, Switzerland by -43%, the Czech Republic by -34%, and Puerto Rico by -32%.
RunnerClick
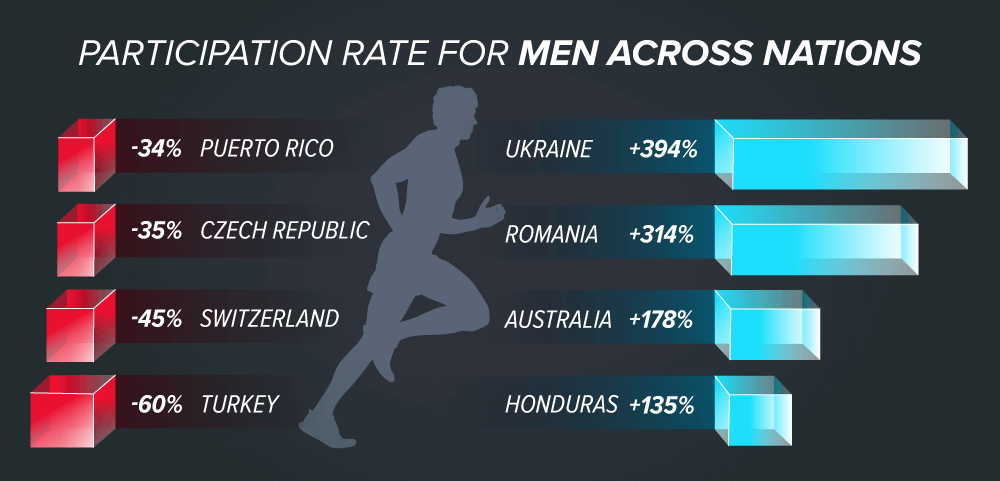
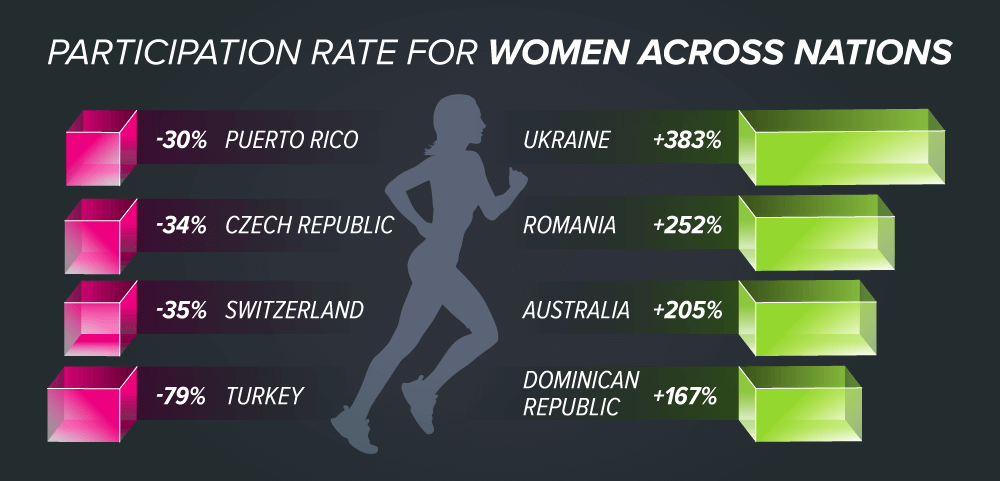
Participation Rate for Each Gender Across Nations
Ukraine had the biggest increase for both men, +394%, and women, +383%
Turkey had the biggest decline for men at -60%
Turkey also had the biggest decline for women at -79%
We also decided to break down the overall participation for each gender in these nations to get a better look into the specifics as to where those increases and decreases fall. Ukraine had an increase of +394%, for men and +383% for women, Australia had an increase of +314% for men and +205% for women, Romania showed an increase of +178% for men and +252% for women, Honduras showed an increase of +135% for men and +132% for women, The Dominican Republic had an increase of +91% for men and +167% for women, Spain showed an increase of +106% for men and +137% for women, and Iceland had an increase of +82% for men and +145% women.
When it comes to a decrease in participation, Turkey tops the list with a decrease of -60% for men and -79% for women, followed by Switzerland with a -45% decrease for men and -35% decrease for women, Czech Republic with a decrease of -35% for men and -34% for women, and Puerto Rico with a decrease of -34% for men and -30% for women
RunnerClick
RunnerClick
Omitted data
In order to avoid any influence of professional sports within our results of recreational runners, we omitted any elite runners and runners with a finish time that was less than 2:30:00 for men and 2:45:00 for women.
We omitted any nations with less than 100 runners.
We omitted any nations that had less than 15 men and 15 women for each year from 2014-2017
We omitted any data from marathons that did not have gender, age, and nationality.
We omitted Japan, Malaysia, India, Indonesia, the Philippines, Hong Kong, Lithuania, and The United Arab Emirates due to some questions pertaining to the data.
About the Researchers
Miranda Hanson, Researcher and Professional Blogger, assisted in the writing, the organization of all collected data, as well as the research and documentation that was used in this study.
Nataliia Iatsenko, Ph. D. Professor in Mathematical Research, Doctor of Philosophy (Ph.D.), Radiophysics and Electronics from V.N. Karazin Kharkiv National University, organized and orchestrated all of the data analysis.
Patrick Luck, a software developer, joined the project to help support the team in research. He has a Masters Degree from the University of Phoenix and is certified in the Java Programming language by Oracle. Patrick’s role was to retrieve marathon statistics from the internet and load data into a centralized database for the team members.
Feel free to use any information from this study, including visuals, graphs, and statistics, as long as you make direct reference to this page.
To review the data pulled and the full report, click here.
The Daily Run
Join over 10,000 subscribers that receive running routines, motivation, tools, playlists & giveaways. Sent to your inbox every day.