An In-depth Look into the Boston Marathon
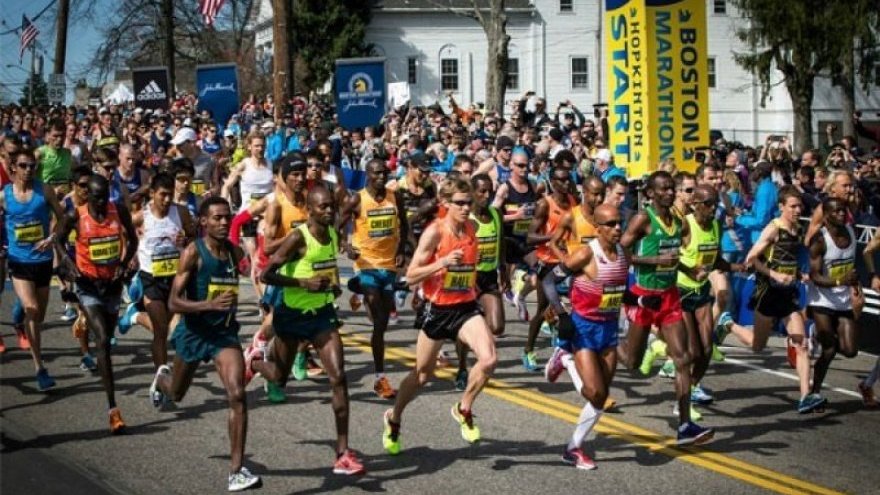
Now that the 123rd anniversary of the Boston Marathon has come to an end and the results finalized, it’s time to take an in-depth look at the overall statistics and see where the numbers fall. The fastest male recreational runner was from the United States and was in the age group 20-29 with a time of 2:30:01. The fastest female recreational runner was also from the United States and in the age group of 20-29 with a time of 2:45:28.
With these new results, we decided to take a deeper look into our marathon research results that were published earlier this year and compare all of the recreational runners from the years 2014-2019. According to these results, not only is Boston still one of the most popular marathons, but it is still one the fastest marathons with an overall average finishing time of 3:57:26. The overall average finishing time has also improved over the years by 4.1% or +0:10:03.
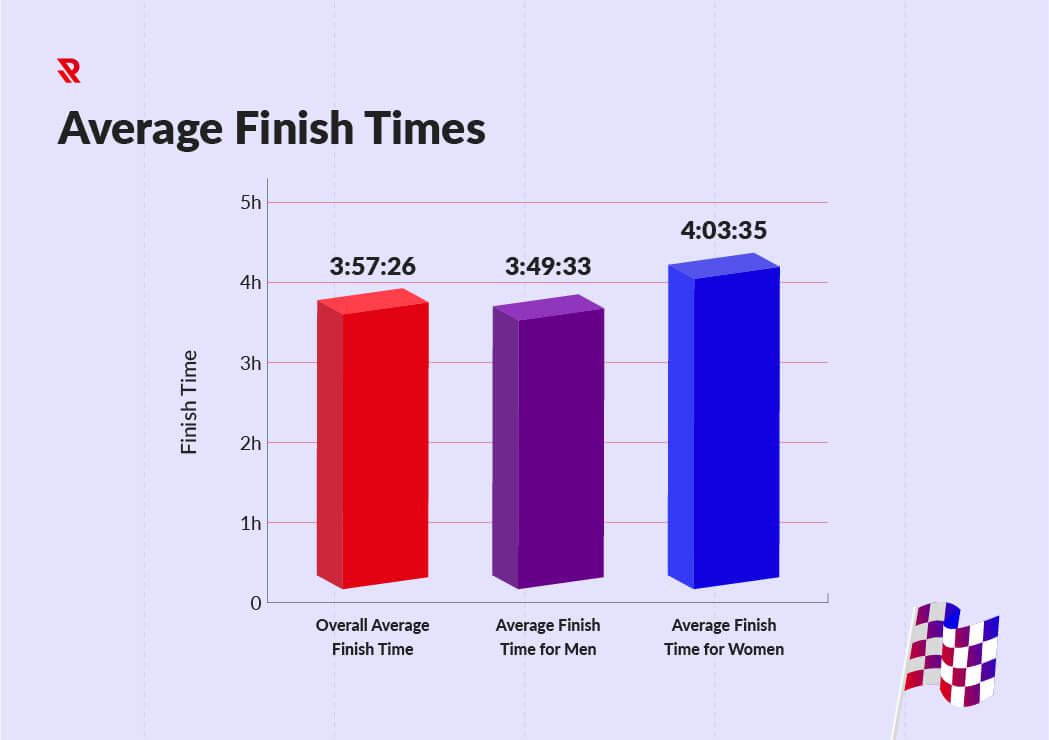
Breaking down the average finish time by gender for these years, the men still hold a steady lead with an average finishing time of 3:49:33 which is 0:14:02 faster than the women’s average finishing time of 4:03:35.
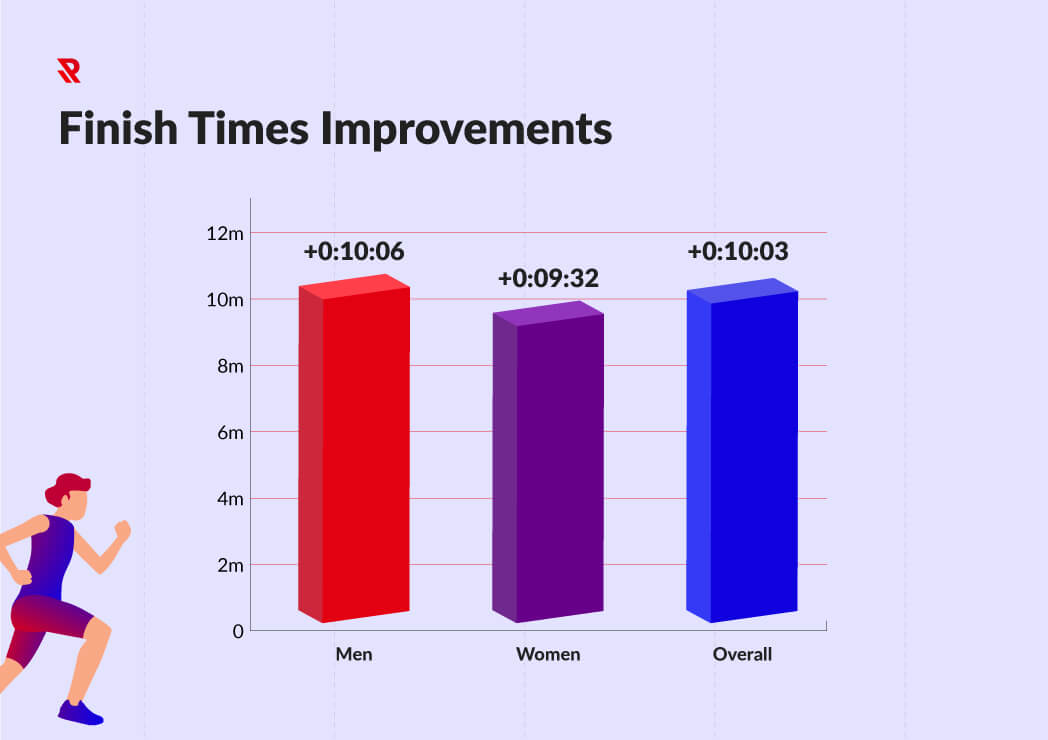
A further look into the average finish times by gender reveals that both men and women have improved on their finish times over these 6 years. Men have improved by 4.3% or +0:10:06 and women have improved by nearly 4% or +0:09:32. The average finish time for the men for each year are: 2014: 3:53:58, 2015: 3:36:47, 2016: 3:45:50, 2017: 3:48:58, 2018: 4:08:10, and 2019: 3:43:52. The average finish time for the women for each year are: 2014: 4:15:12, 2015: 3:38:27, 2016: 4:05:56, 2017: 4:09:12, 2018: 4:07:04, and 2019: 4:05:40.
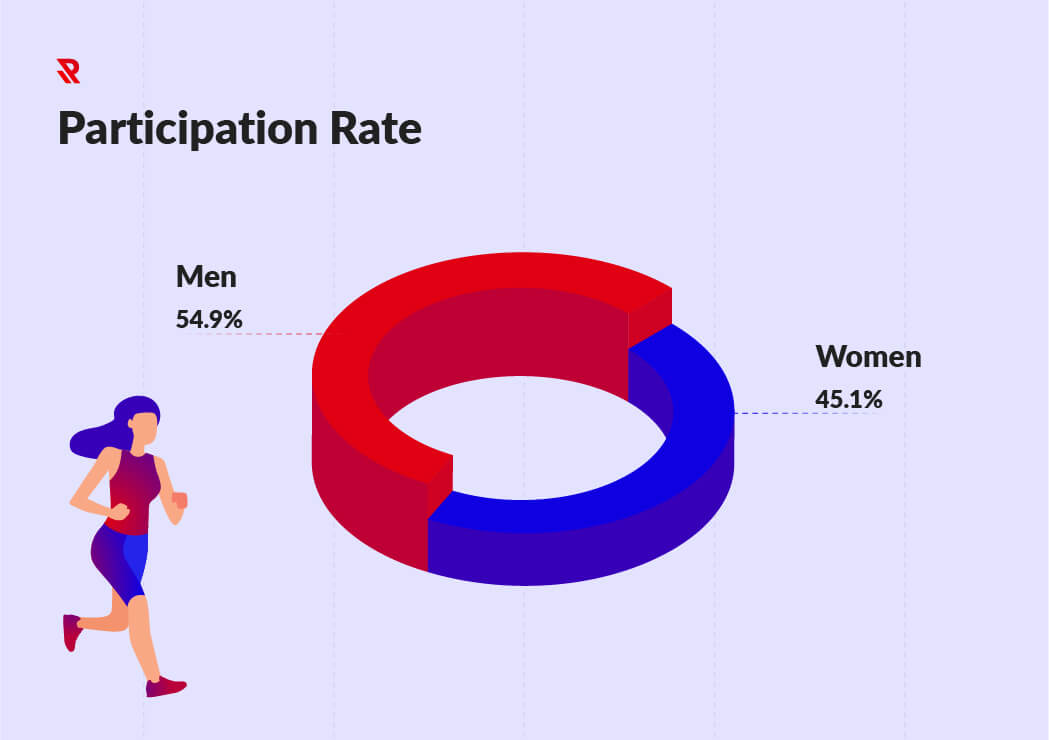
We also looked into the overall participation rate for each gender, and it is safe to say that, even though the men have held a steady lead of 54.9% over the years of 2014-2019, the women have held strong with a participation rate of 45.1%. This also shows that the Boston Marathon is not only one of the most well-known and largest marathons, but it is also one of the most gender equal marathons as well.
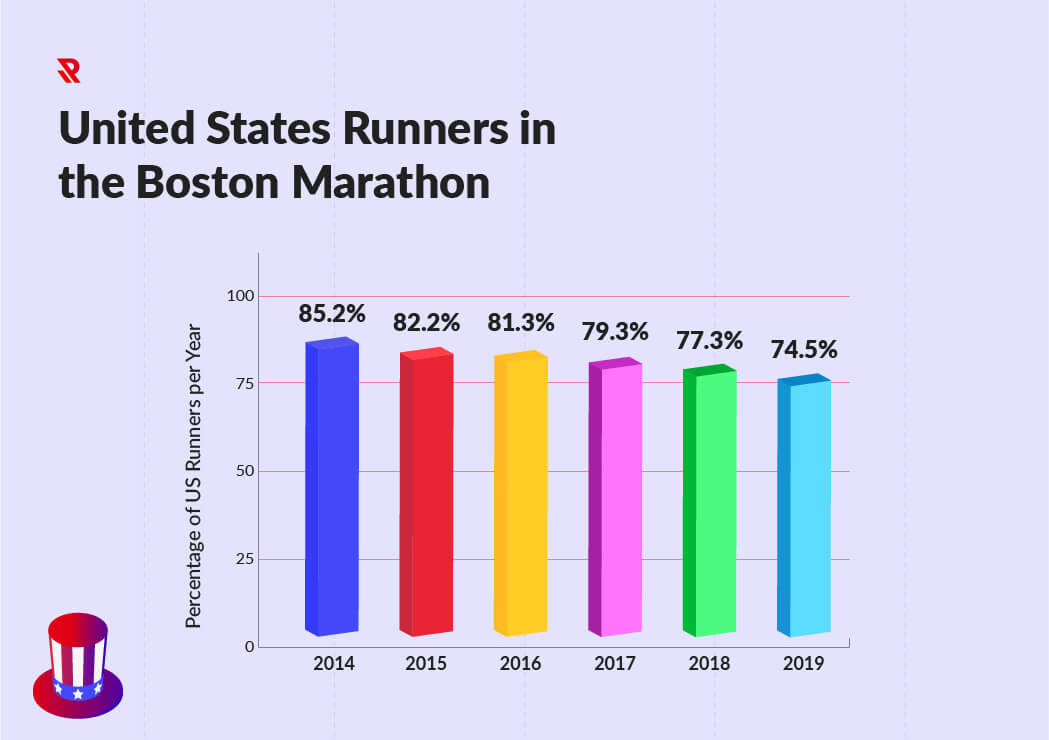
Since we are on the subject of equality, it is worth mentioning that the Boston Marathon is also becoming more diverse. The percentage of U.S. based runners has been on a steady decline for the last 6 years! In 2014, the percentage of U.S. runners was at 85.2%, 2015 was at 82.2%, 2016 was 81.3%, 2017 was 79.3%, 2018 was at 77.3% and 2019 was at the lowest yet, with the U.S. runners at 74.5%. That is a decrease of -12.56%!
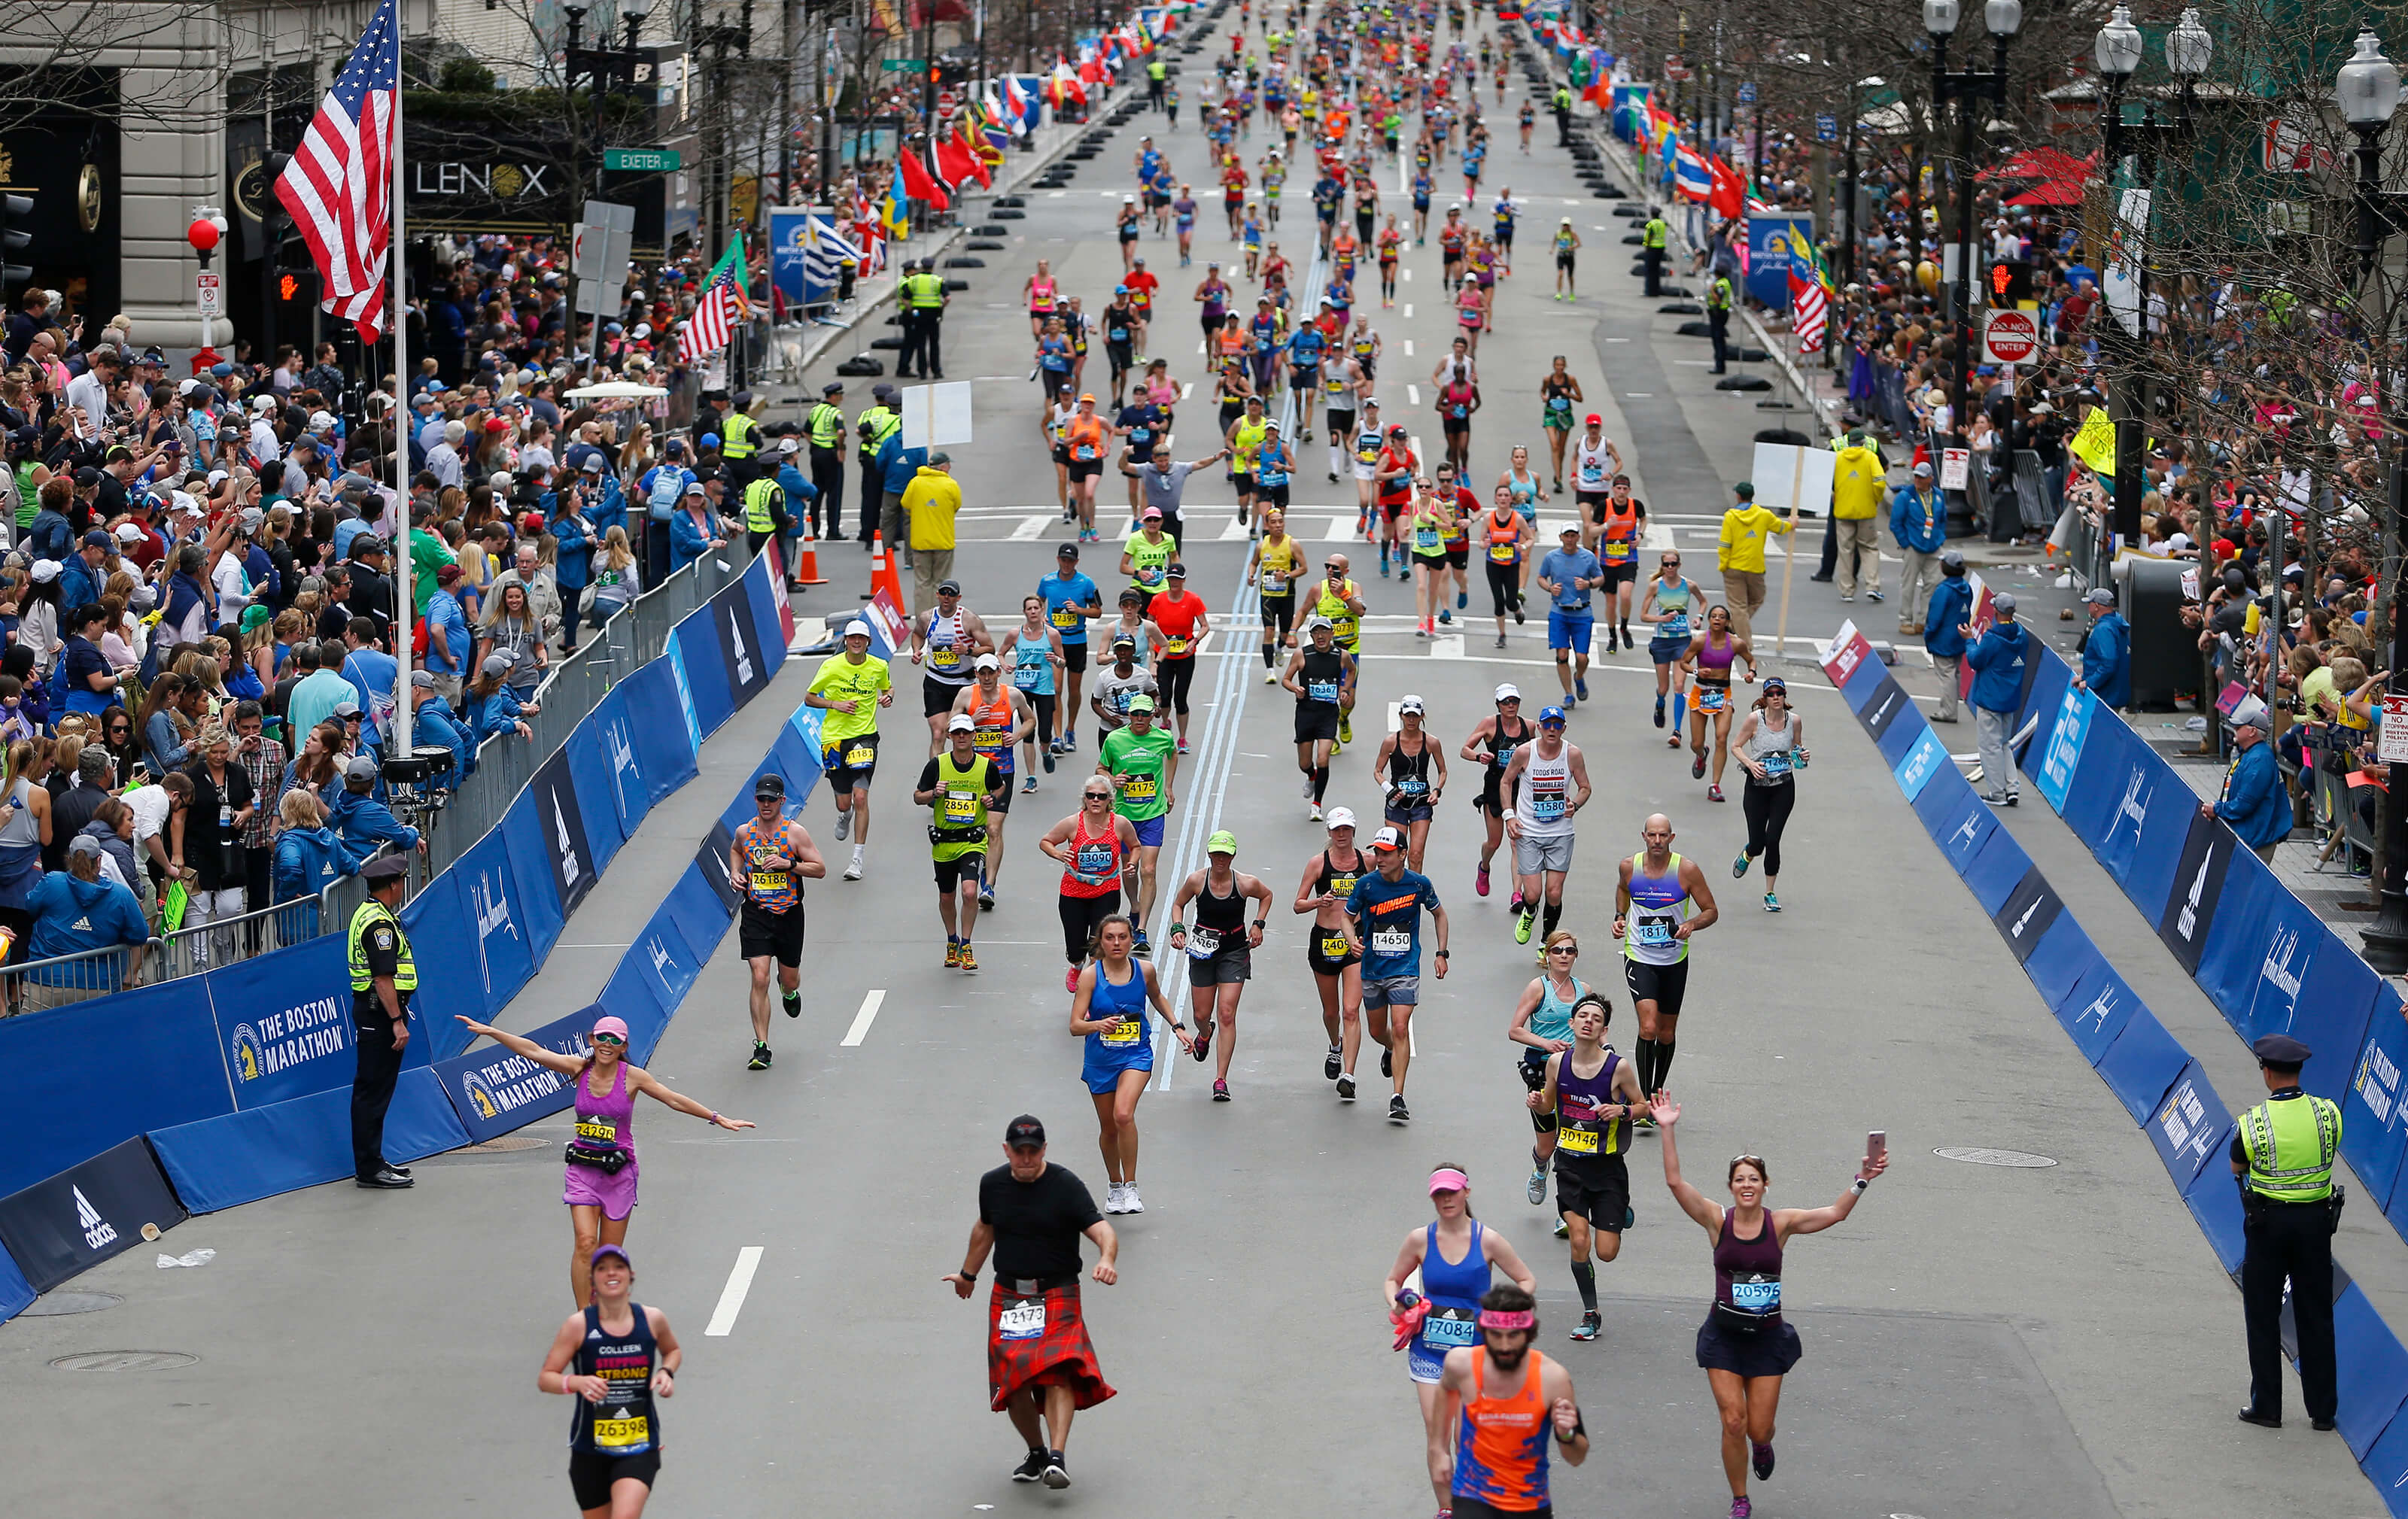
Analyzing over 150,000 runners, we also decided to take a better look into the different age groups and how they stack up next to one another. The age group 40-49 happens to be the most popular age group with over 50,000 from the years 2014-2019! But, just because this is the most popular age group doesn’t necessarily mean that it’s the fastest age group. The fastest age group for all 6 years is the age group 20-29 with an average finishing time of 2:56:39.
One of the more interesting statistics when it comes to age groups is that the number of participants in the age group 80-89 has increased by 20%, while the age group 20-29 has seen a -18.72% decline in participation over this time span!
Omitted Information
*Since this was a study based on recreational runners only, we omitted any men with a finish time of 2:30:00 or better and any women with a finish time of 2:45:00 or better.
*Original research including methodology can be found here.
Latest Articles
 Is Running on a Treadmill Easier Than Running Outside?Runners have their own preferences, whether it is treadmill running, running outside on the road, or exploring trails. So...
 Is It OK to Use Trail Running Shoes on the Road?While trail running shoes can be used on roads, especially in situations where a runner encounters mixed terrains or pref...
 How to Fix Sore Quads After Running?Rest, ice, gentle stretching, and over-the-counter pain relievers can help soothe sore quads after running. Also, ensure ...
 10 Fruits With The Most Electrolytes to Replace Sports DrinksThese fruits are high in electrolytes such as potassium, magnesium, and calcium, essential for hydration, muscle function...

